Every number, every curve, every prediction
Test-set metrics for the U-Net baseline, the structural comparison across all five models, 35 epochs of training telemetry for each run, and the prediction galleries they produced. All values are read directly from the notebook cell outputs.
Structural agreement with expert masks
All five models scored on tumour-bearing validation slices, comparing the argmax label map of the prediction against the expert annotation.
PSNR (dB)
higher is betterBars scaled across the observed range 21.5–26.0 dB to make the differences legible; the axis does not start at zero.
SSIM
higher is betterScaled across 0.933–0.959. The top three sit within 0.0001 of each other — well inside run-to-run noise.
| Model | Discriminator | Params (D) | Seg loss | PSNR | SSIM | Train | Final D loss |
|---|---|---|---|---|---|---|---|
| Model A — U-Net | none — pixel-wise loss | — | 0.0177 | 25.3817 | 0.9577 | 88 min | — |
| Model D — 4×4, s2 | 4×4 kernel, stride 2 | 727,489 | 0.0198 | 25.9556 | 0.9583 | 137 min | 1.1529 |
| Model D + CLAHE | 4×4 kernel, stride 2 | 727,489 | 0.0194 | 24.7633 | 0.9582 | 147 min | 1.0928 |
| Model B — 3×3, s2 | 16×16 patch grid | 1,560,897 | 0.0378 | 24.6395 | 0.9510 | 148 min | 1.0109 |
| Model C — 3×3, s1 | 16×16 patch grid | 1,559,937 | 0.0355 | 21.6154 | 0.9341 | 211 min | 12.4787 |
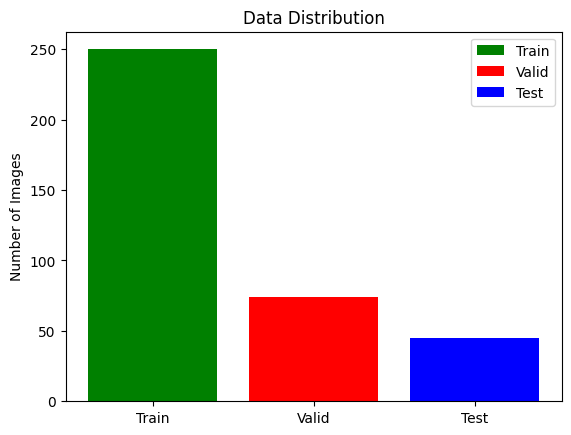
Read these gaps as directional, not exact. The train/validation split was drawn without a fixed random seed, so each notebook evaluated on a different partition — 4,453 tumour slices for Model A, 4,623 for Model B, 4,524 for Model C. Sub-decibel differences sit inside that variance. The 3 dB collapse of Model C does not, and neither does the artefact / no-artefact distinction. Where the accompanying paper quotes different figures for Model D, the notebook-measured value is used throughout this site. Full limitations →
Model A on the held-out test set — 45 patients, 4,500 slices
| Tumour sub-region | Dice |
|---|---|
| GD-enhancing tumour | 0.7084 |
| Peritumoral edema | 0.6995 |
| Necrotic / non-enhancing core | 0.5687 |
| Mean over all four classes | 0.6124 |
Reading the numbers honestly
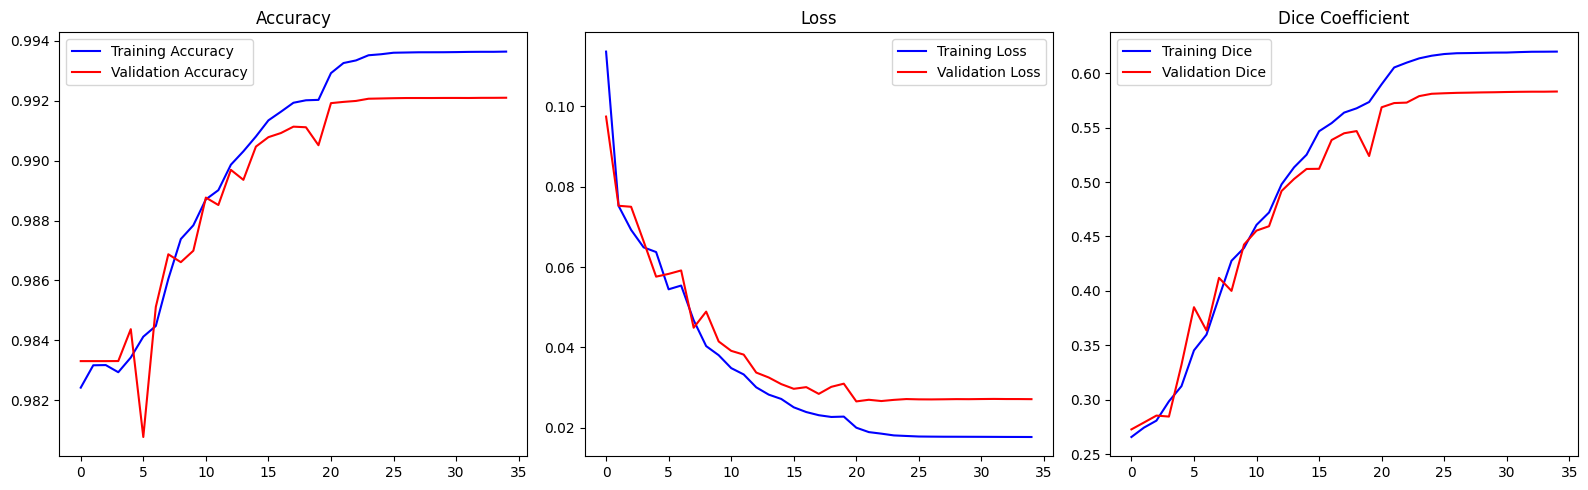
Accuracy near 99 % sounds decisive and is almost meaningless here: predicting "background" for every voxel would already score ~98 %. Dice is the number that matters, and 0.57–0.71 per sub-region is a solid result for a compact 2D model trained for 35 epochs on downsampled input — well short of the 0.85+ that 3D ensembles reach on the BraTS leaderboard.
The ordering across sub-regions is itself a sanity check on the pipeline. The enhancing rim is brightest on T1ce, edema is largest and cleanest on FLAIR, and the necrotic core is small, irregular and defined by the absence of enhancement — hardest for all three reasons at once.
Mean IoU is omitted deliberately. The pipeline configures
tf.keras.metrics.MeanIoU(num_classes=4) with one-hot targets and softmax
probabilities instead of integer class indices, so it degenerates to a constant 0.5. No IoU
figure from these runs is trustworthy. Why →
35 epochs, five runs
Reconstructed from the printed epoch logs of each notebook and the baseline's
training.log. Click a legend entry to isolate a run; hover the plot to read exact
values.
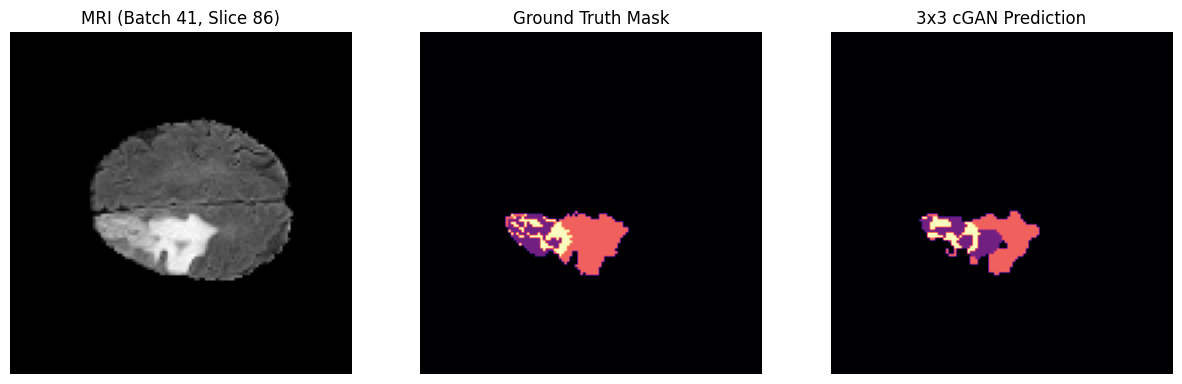
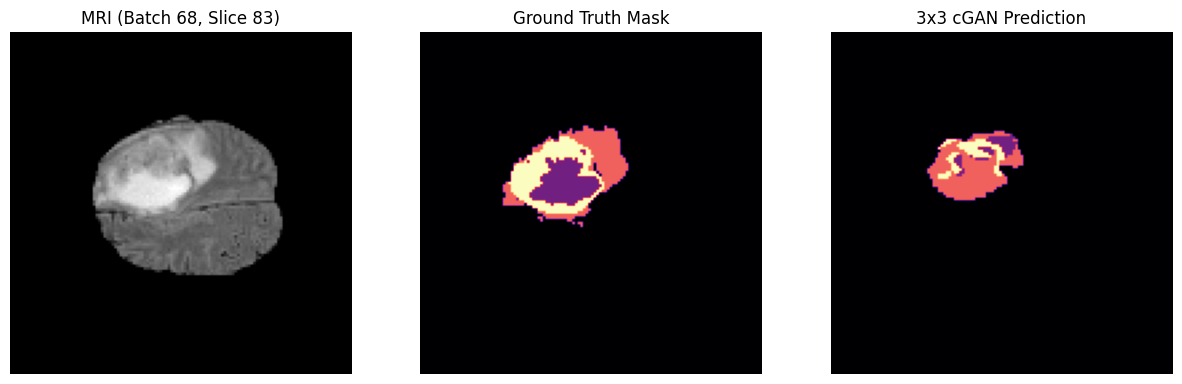
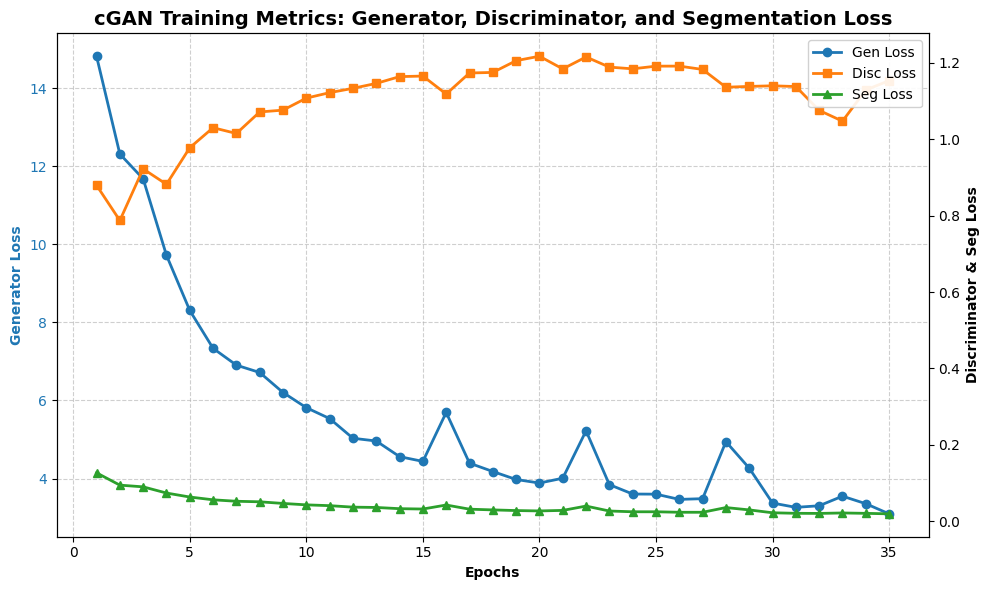
The discriminator plot is the most informative chart in this study. Models B and D settle near 1.0 — the equilibrium value when a critic is guessing at chance, which is exactly where a healthy GAN lands. Model C instead climbs from 9.06 to 12.48: it is getting steadily worse at its own task while the generator's segmentation loss keeps falling. That divergence is the PatchGAN Paradox in telemetry form, and the mechanism behind Model C's 3 dB PSNR deficit.
Baseline learning rate drops are visible as the flattening after epoch
~24, when ReduceLROnPlateau cut it by 5× twice in succession down to the
10-6 floor. The best checkpoint by validation loss was epoch 21
(val_loss 0.026537).
Side by side, on unseen scans
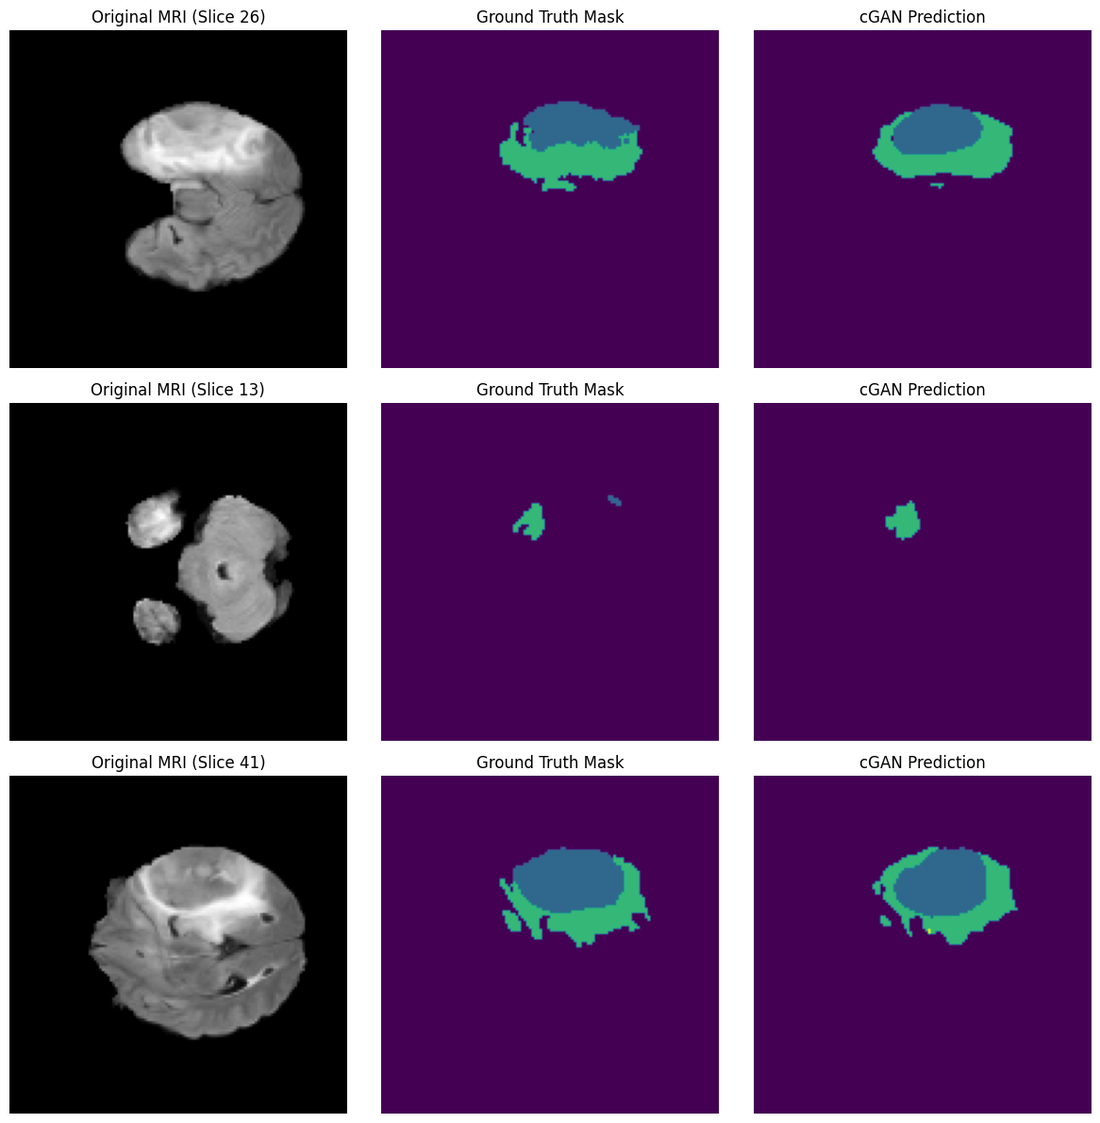
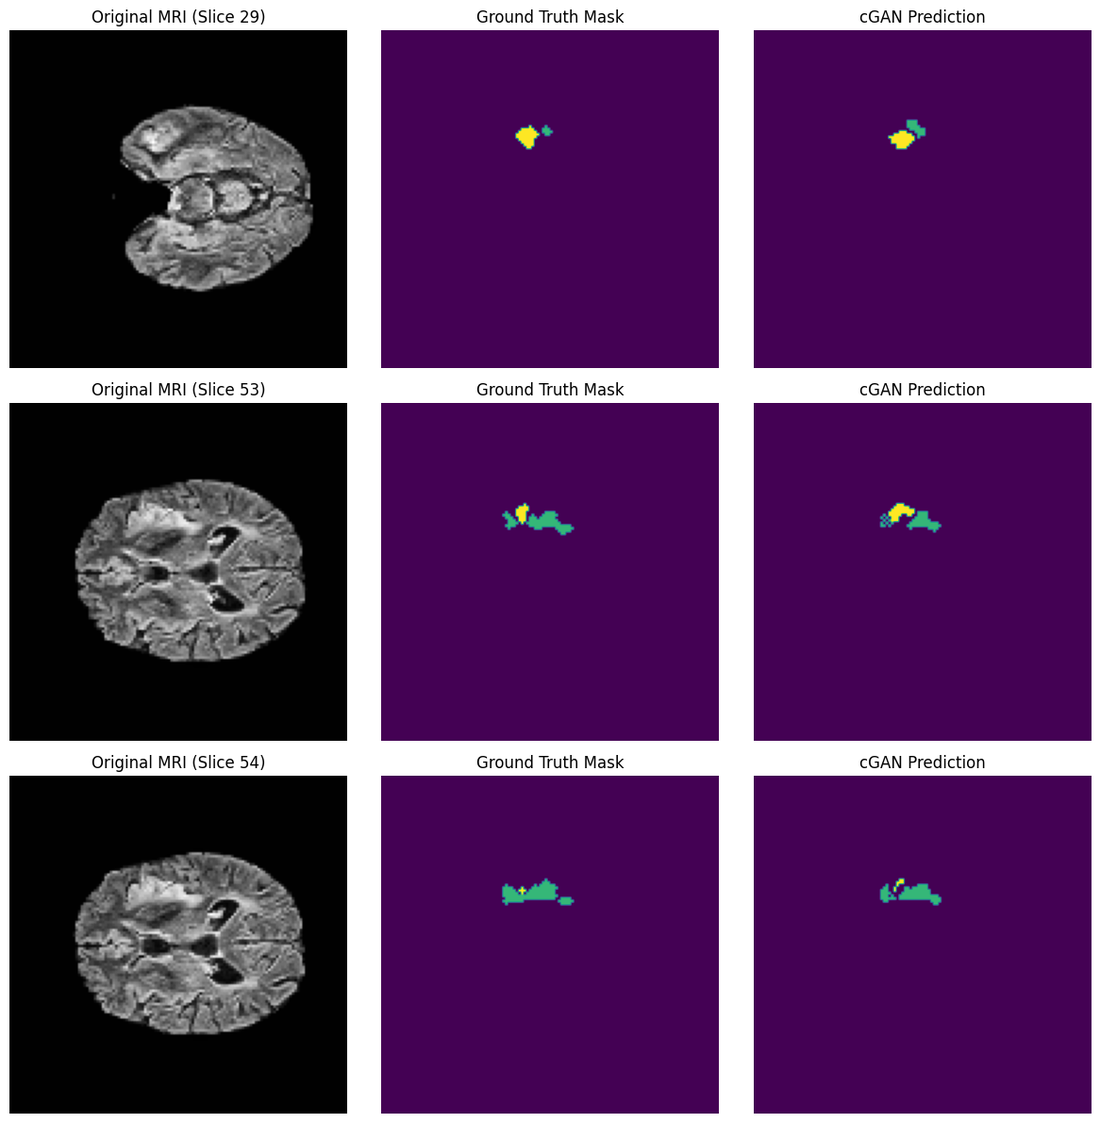
Every figure below is an unmodified output cell from the notebook that produced it. Click any image to open it full size.
- Necrotic / core
- Peritumoral edema
- GD-enhancing tumour
- Colour maps vary between notebooks — each figure carries its own scale
Model D — the Goldilocks Zone
Models B and C — the two failure modes
Model A — per-class probability maps
Six panels per patient: the FLAIR slice, the expert overlay, all predicted classes together, then necrotic core, edema and enhancing tumour separately.





argmax.As-run training plots
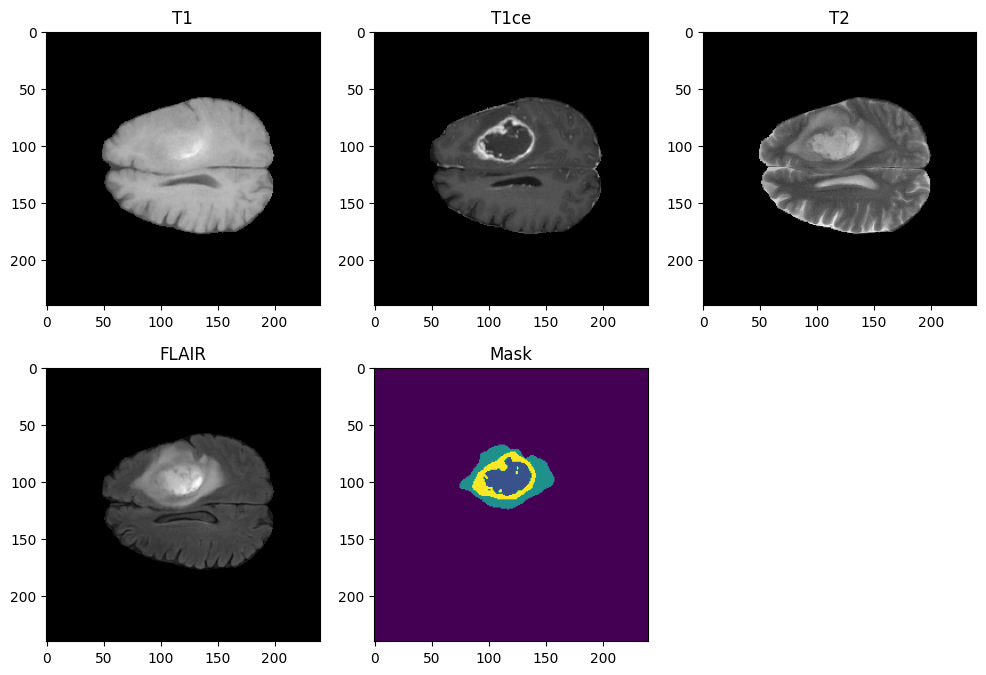
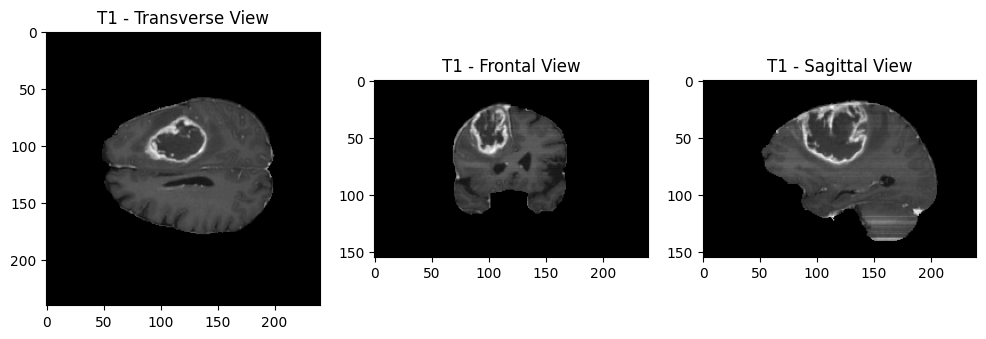
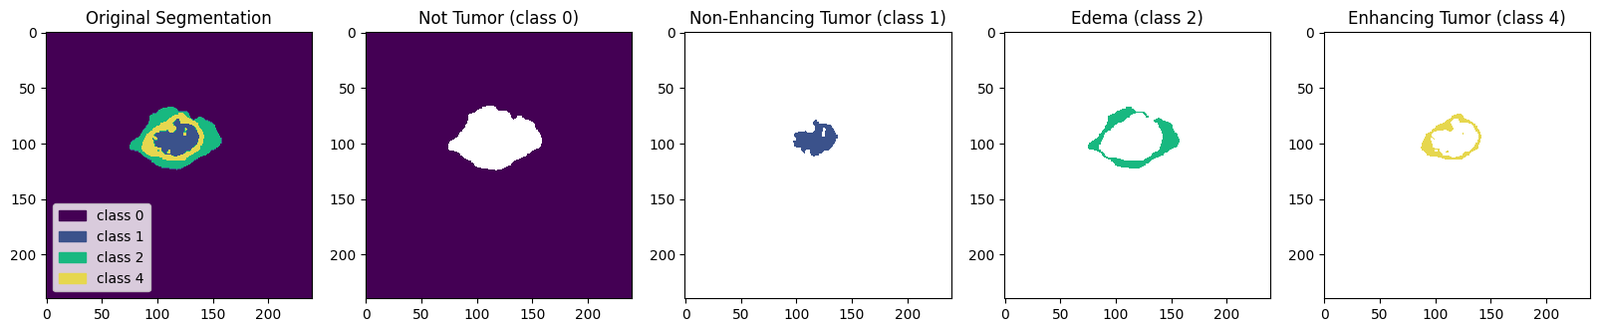
What the pipeline sees before training starts